

Introducing an app that makes creating graphs incredibly easy.
Ever felt that creating a simple comparison chart takes more time than expected with Excel?
This app is designed to address such concerns.
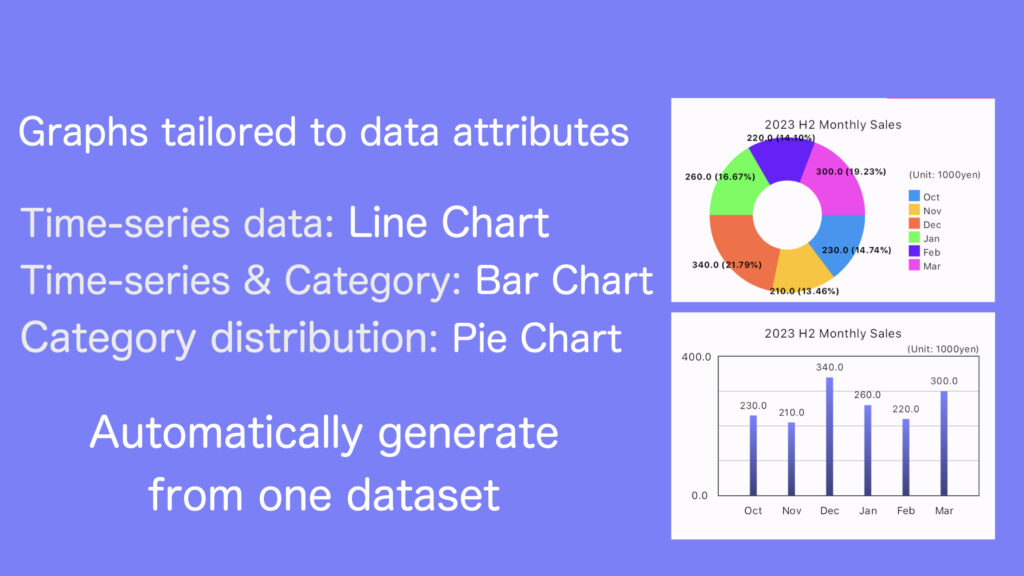
Enter values, and the app creates a graph. Just add labels where you want to highlight, and the numbers appear on the graph.
Additionally, you can save images with a single touch, making it easy to add to your existing documents.
All features are completely free. No full-screen ads when saving images.
However, note that automatic drawing may have a slight learning curve:
- Value Input: No strict limits, but adjust units to reduce character count (e.g., [Unit: K yen]).
- Data Labels: Adjust dimensions to fit ‘20231101’ format or use shorter labels (e.g., ’23/11/01′).
- Pie Chart Drawing: If the total is exactly 100, it displays percentage values. Otherwise, it calculates and displays both input values and percentage distribution.
Feel free to comment if there’s anything missing for your business use.
Let’s EasyGraphMaker!! Thank you!
iOS App Download Link
https://apps.apple.com/app/id6473511598

Android App Download Link
https://play.google.com/store/apps/details?id=info.bawapps.graph


Comments